Go to database main page which lists all the databases that can be monitored and managed by Cloud Control.
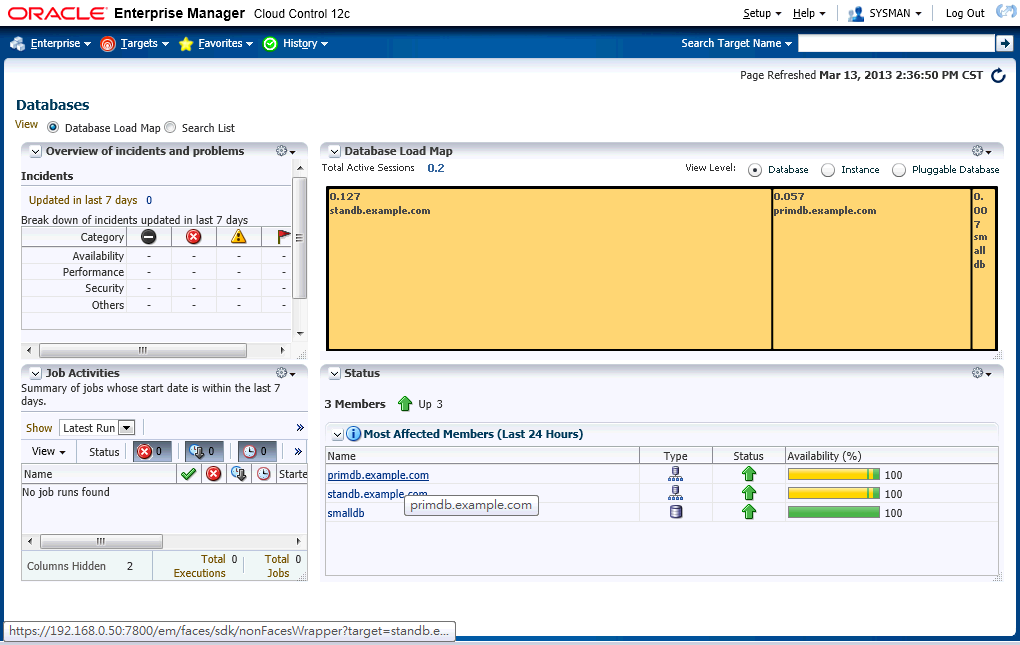
There are three databases listed and all up in our case:
- primdb.example.com: a primary cluster database which has two instances.
- standb.example.com: a standby cluster database which has two instances.
- smalldb: a very small database resides in the first node of two primary servers.
Click the primary cluster database link.

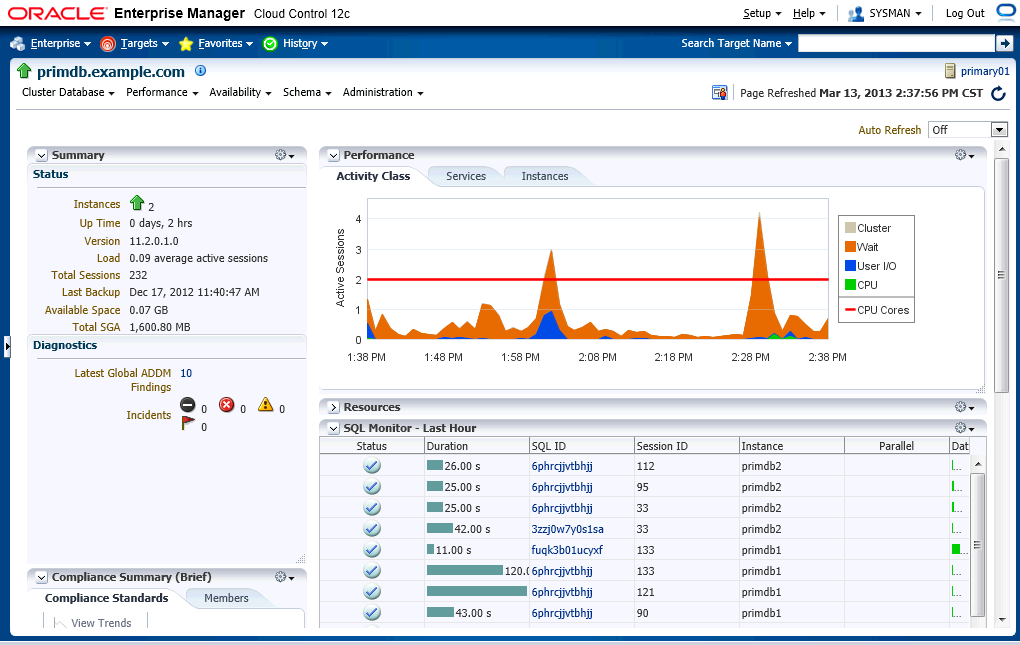
The page shows summarized information of the primary cluster database.
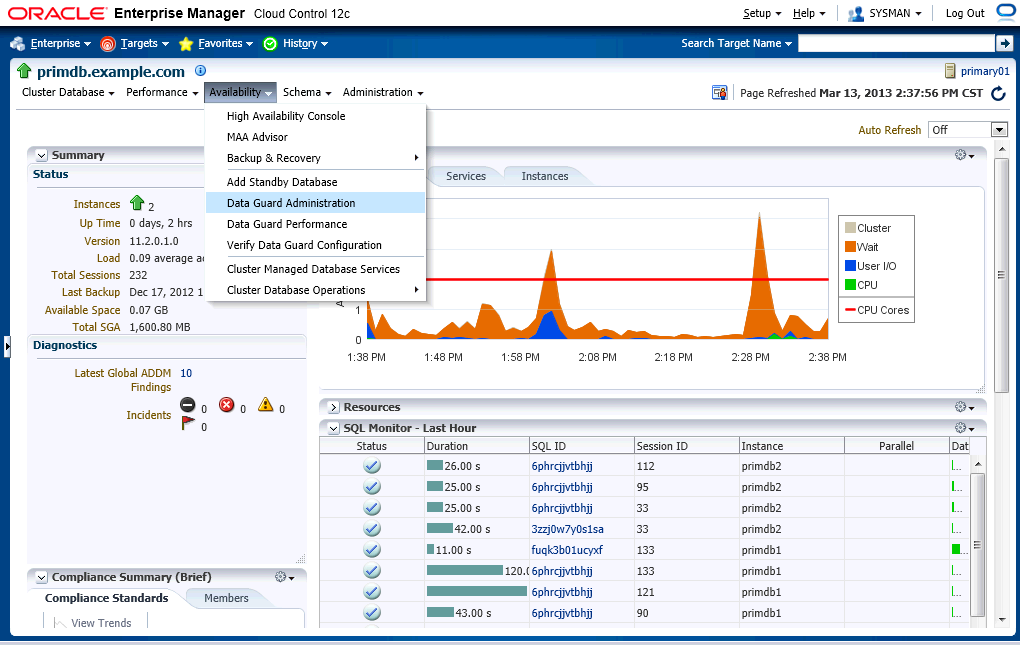
Let's find the entry of Data Guard Administration, then click.
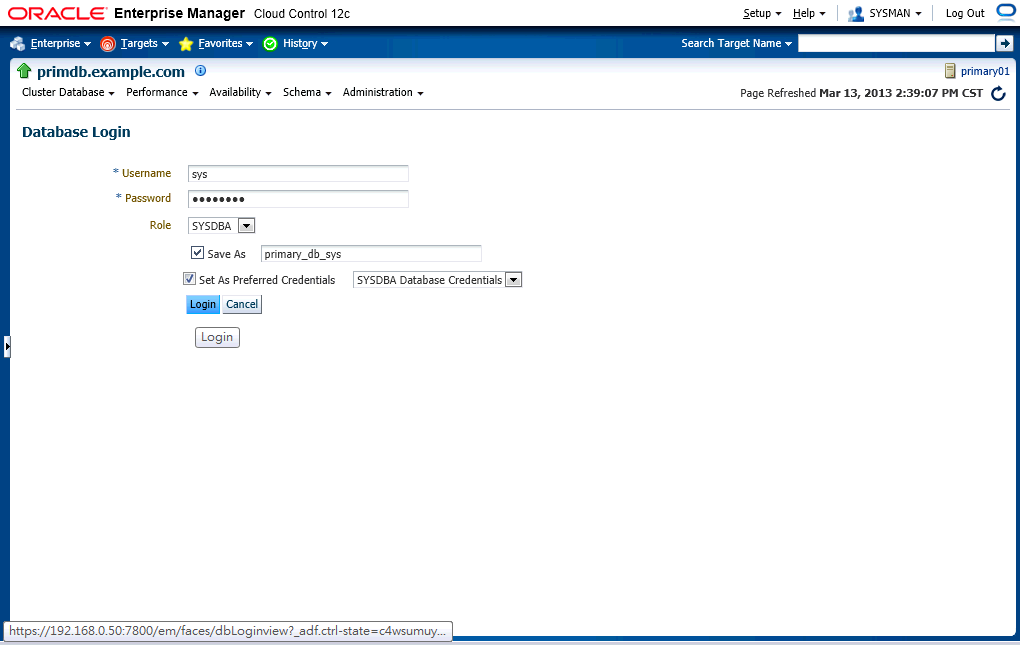
Enter database credentials to proceed.
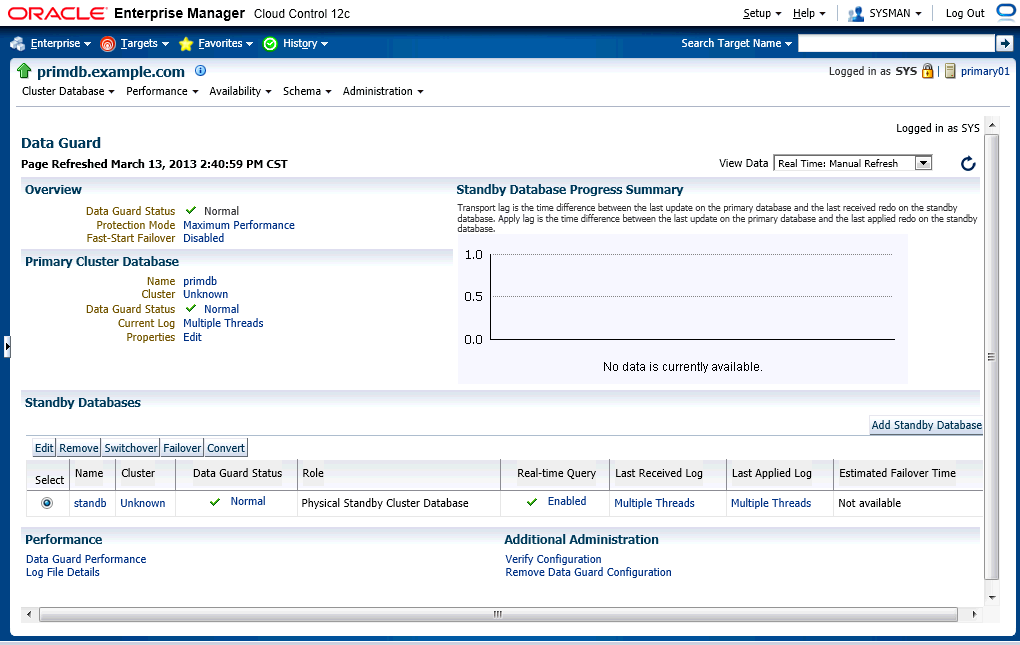
You can see Data Guard is basically healthy except an applying lag problem needs to be deal with.
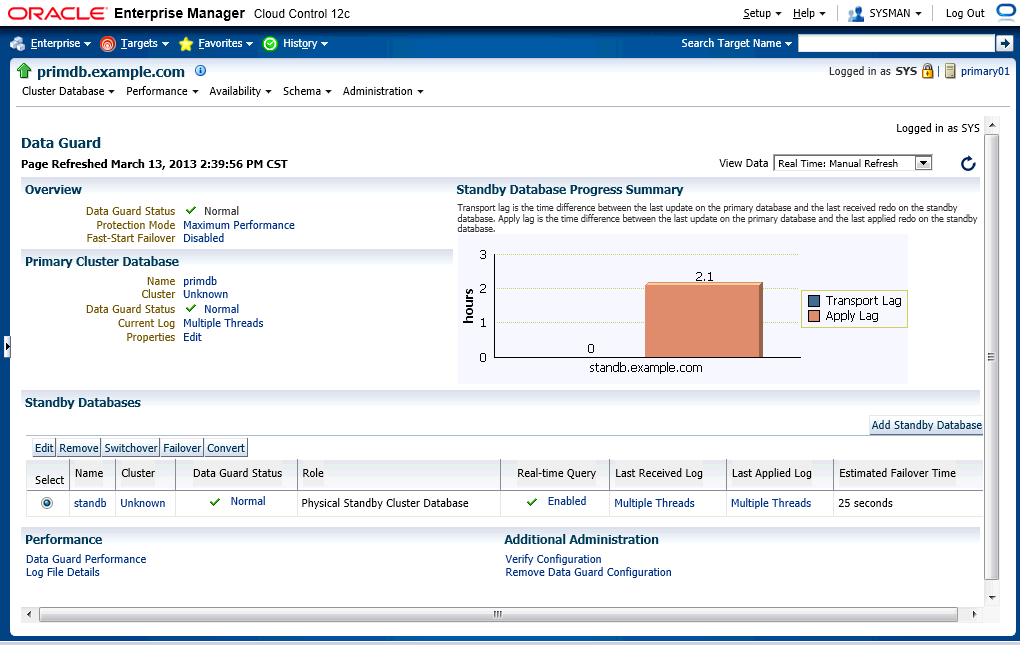
Since I can't see any entry that can manage the broker configuration, so I decide to go back to DGMGRL to solve the problems.
DGMGRL> show database standb


Database - standb


  Role:            PHYSICAL STANDBY

  Intended State:  APPLY-ON

  Transport Lag:   0 seconds

  Apply Lag:       2 hours 10 minutes 49 seconds

  Real Time Query: ON

  Instance(s):

    standb1

    standb2 (apply instance)


Database Status:

SUCCESS


DGMGRL> enable database standb

Enabled.

DGMGRL> show database standb


Database - standb


  Role:            PHYSICAL STANDBY

  Intended State:  APPLY-ON

  Transport Lag:   0 seconds

  Apply Lag:       0 seconds

  Real Time Query: ON

  Instance(s):

    standb1

    standb2 (apply instance)


Database Status:

SUCCESS
Refresh the page to reload newest status. Now, it's back to normal.
